Lab 04 MOS Device Characterization
Hung, Bill Chun
Wai
Objectives
Find
the device parameters for an n-channel MOSFET. From the parameters, you will reproduce its I-V characteristics
and compare them to
SPICE. The characteristics will be compared to the SPICE
level 1 model. We will also
compare your data with data from the HP 4155 analyzer. The
key concepts you should
learn in this lab are:
• determining which region of operation the MOSFET is
in depending on the values
of VGS and
VDS,
• application of correct equations for ID depending on the region of operation,
• extraction of basic SPICE parameters from experimental
measurements
Procedure/Measurement Report
Results/Analysis
Figure
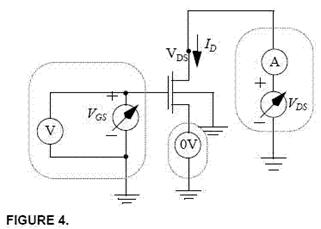
1. Figure 4
Circuit Setup

Figure
2. Drain
Current Versus Vds Plot
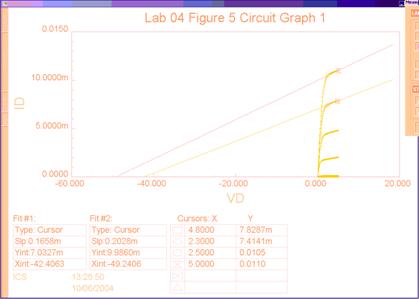
Figure 3.
Figure
4.
Procedure 3.0 Part 4. Determine Lamda,n from the plot ¡°Lab 04 Figure 4 Circuit¡±
Using, Lamda,n = -1/(x-intercept)
The
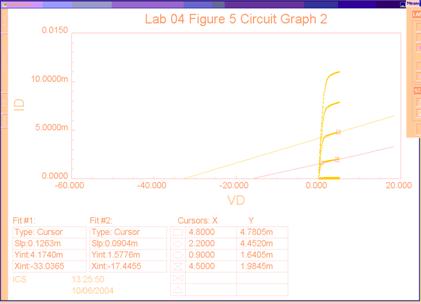
graph from Figure 2, is rescaled into Figure 3 and
Figure 4 above. The tangent lines of the saturation regions are shown.
Theoretically, the x-intercepts should be the same, but the experimental values differs. So the average of the data is calculated.
|
X-Intercept (V) |
Lamda, n = -1/X-Intercept (V^-1) |
|
-42.4063 |
0.02358 |
|
-49.2406 |
0.02031 |
|
-33.0365 |
0.03027 |
|
-17.4455 |
0.05732 |
|
|
Average: 0.03287 |
The
average value of Lamda,n is 0.03287 V^-1, which is also the
experimental value of Lamda,n
Procedure 3.0 Part 5
The expected Vd,sat
is 2V when Vgs is 3V, and the measured Vd,sat is 1.7V.
The expected Id,sat is 7mA for Vgs is 3V, and
the measured Id,sat is 5mA.
The
shape of the Figure 2 is the shape of Id vs. Vds
curve. Both the expected and the measured curve are slightly upsloping in the
saturation region.
Procedure 3.0 Part 6.
The
printout is shown in Figure 2 to Figure 4.
Procedure 3.1 Part 2
The
equation for Id when the MOSFET is operating in the triode region is
Id
= u* Cox (W/L) (Vgs ¨C Vtn ¨C Vds/2) Vds
Procedure 3.1 Part 3 Determination of Vtn
and Kn Parameter in the Triode Region
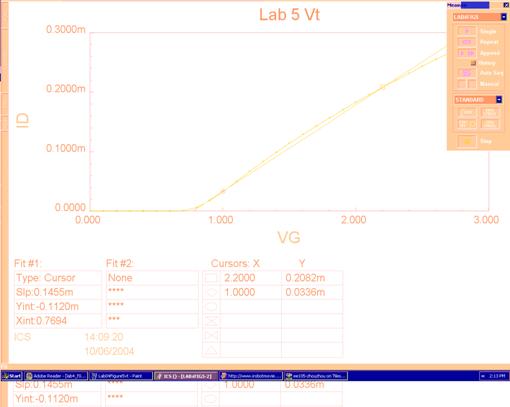
Figure
5. Id versus
Vgs
Since Id = u* Cox (W/L) (Vgs ¨C Vtn ¨C Vds/2)
Vds
Id = u* Cox (W/L)*Vds*Vgs - u* Cox (W/L)*Vds*Vtn - u* Cox/2*(W/L)*Vds^2
So the slope of the graph is
u*
Cox (W/L)*Vds = 0.1455 mS (from Figure 5), whereW/L = 46.5/1.5
Kn = u* Cox = 0.1455mS / ( (46.5/1.5) *50mV)
= 93.9 uA/V^2
Vn is the x-intercept of Figure 5.
Vn = 0.8 V
Procedure 3.1 Part 4
Printout is shown in Figure 5
Procedure 3.2 Part 2
The
equation for Id when the MOSFET is operating in the triode region is
Id
= u* Cox (W/2L) (Vgs ¨C Vtn)^2
Procedure 3.2 Part 3 Determination of Vtn
and Kn Parameter in the Saturation Region
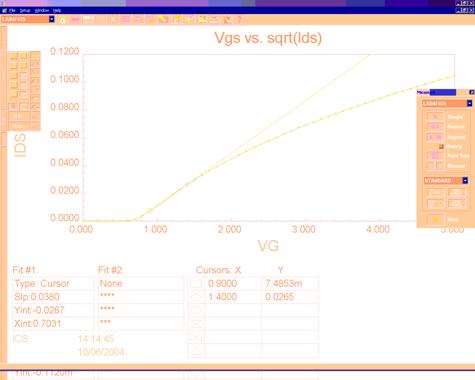
Figure
6. sqrt(Id) versus Vgs
Since Id
= u* Cox (W/2L) (Vgs ¨C Vtn)^2, where W/L = 46.5/1.5
Sqrt(Id) = sqrt (u* Cox (W/2L) ) (Vgs ¨C Vtn)
Slope = sqrt (u* Cox (W/2L)
) = 0.0380
Kn = u*Cox = 0.0380^2 / (46.5/(1.5*2)) = 93.2 uA/V^2
Vn
is the x-intercept of Figure 6.
Vn = 0.8 V
Procedure 3.2 Part 4
Printout is shown in Figure 6
Procedure
3.3 Comparison with PSpice
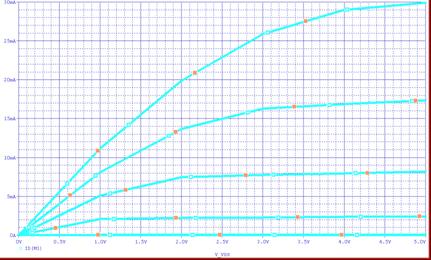
Figure 7. Id vs. Vds
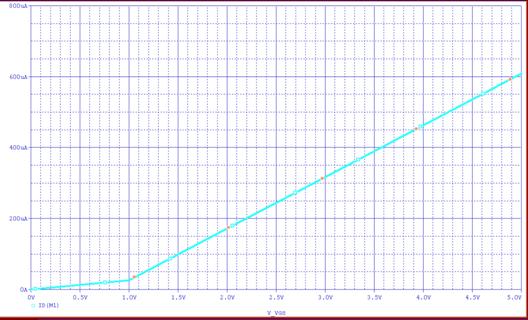
Figure 7. Id vs. Vgs
PSpice
Stimulation with NMOS model of parameters determined by experiment
.model NMOSFET NMOS(KP=93.9U
VTO=0.8 L=1.5U W=46.5U Lambda=0.0328)
PSpice
plot of Figure 7 is almost the same as the experiment plot
shown in Figure 1. Both plots have Id,sat of
|
Vgs(V) |
Id(mA) |
|
0 |
0 |
|
1 |
1 |
|
2 |
2.5 |
|
3 |
8 |
|
4 |
18 |
|
5 |
20 |
Conclusions
The experimental values determined are
Lamda,n = 0.03287 V^-1
When the MOSFET is in Triode
Kn = 93.9 uA/V^2
Vn = 0.8 V
When the MOSFET is in Saturation
Kn = 93.2 uA/V^2
Vn = 0.8 V
In
this lab, the technique to extract basic parameters are
learned. Determination of the state of the MOSFET by observing Vgs and Vds,
using correct equations for different the
region of operation are learned during the lab.
One of the difficulties about the lab is the
graphs are too rough to determine an exact value.